Search
Close this search box.

Data Visualization with Matplotlib in Python

by

Guvi

This course on Data Visualization with Matplotlib in Python teaches Data Visualization with Matplotlib in Python fundamentals through 3 interactive modules. If you are Beginner, then this course is for you. You can access this course on web and mobile, it’s available in English language.
1799.00
2000.00
10.05% Discount

See all ranking

Data Visualization with Matplotlib in Python

by

Guvi

This course on Data Visualization with Matplotlib in Python teaches Data Visualization with Matplotlib in Python fundamentals through 3 interactive modules. If you are Beginner, then this course is for you. You can access this course on web and mobile. This complete course is available in English language.
1799.00
2000.00
10.05% Discount

See all ranking

3 Modules

with Certifications

7+ Hours

of Recorded Content

4.51 Rated

by 17113 Learners

Language

3 Modules

with Certifications

7 + Hours

of Recorded Content

4.51 Rated

by 17113Learners

Read all Reviews

Language

What's in it for You?

Learn how to use Matplotlib, one of the most widely used Python libraries for data visualization, and implement it with this project-based course that has been curated and taught by industry and subject matter experts. You will learn how to work with Matplotlib and embed plots into applications using various general-purpose toolkits. You will not only be able to create and customize plots using Matplotlib but also learn how to represent datasets as 2D and 3D plots that result in powerful insights. Upon completion of this course, you will have a fundamental grasp of Jupyter Notebook, Matplotlib, and all its dependencies and be able to generate meaningful insights with efficient data visualization.

Key Features:

Internationally Acknowledged Certification
Completely online and learn at your own pace course
Lifelong access to complete course
Four gamified practice platforms
Committed forum support to answer all of your questions
Refund policy of seven days

Topics you will learn

  • Beginner Module

    • Introduction to Matplotlib
    • Installing Matplotlib and dependencies
    • Setup - Jupyter Notebook
    • Getting started with basic of Matplotlib
    • Introduction to pyplot
    • Adding Labels to plot
    • Formatting plot style
    • Specifying axis in plot
    • Adding and customizing markers
    • Adding Titles and Legends to a plot
    • Scatter Plot and categorical plotting
    • Scatter plot in matplotlib
    • Plotting category categorical variables in various format
    • Line and SETP method
  • Intermediate Module

    • Figure and Subplot in Matplotlib
    • Concept of Figure and SubPlotting
    • Plotting multiple figure and plots
    • Applying Grids to the plot
    • More Plots in Matplotlib
    • Histograms in Matplotlib
    • Bar charts in Matplotlib
    • Pie Charts in Matplotlib
    • Stack plots in Matplotlib
    • Logarithmic plotting in Matplotlib
    • Symlog and logit plot in Matplotlib
    • Polar plot in Matplotlib
  • Advanced Module

    • Working with Time-series data in matplotlib
    • 3D Plotting and visualization in Matplotlib
    • Working with Audio data in Matplotlib
    • Working with images in matplotlib
    • Saving plots as PNG and PDF file format in Matplotlib

Course Offerings

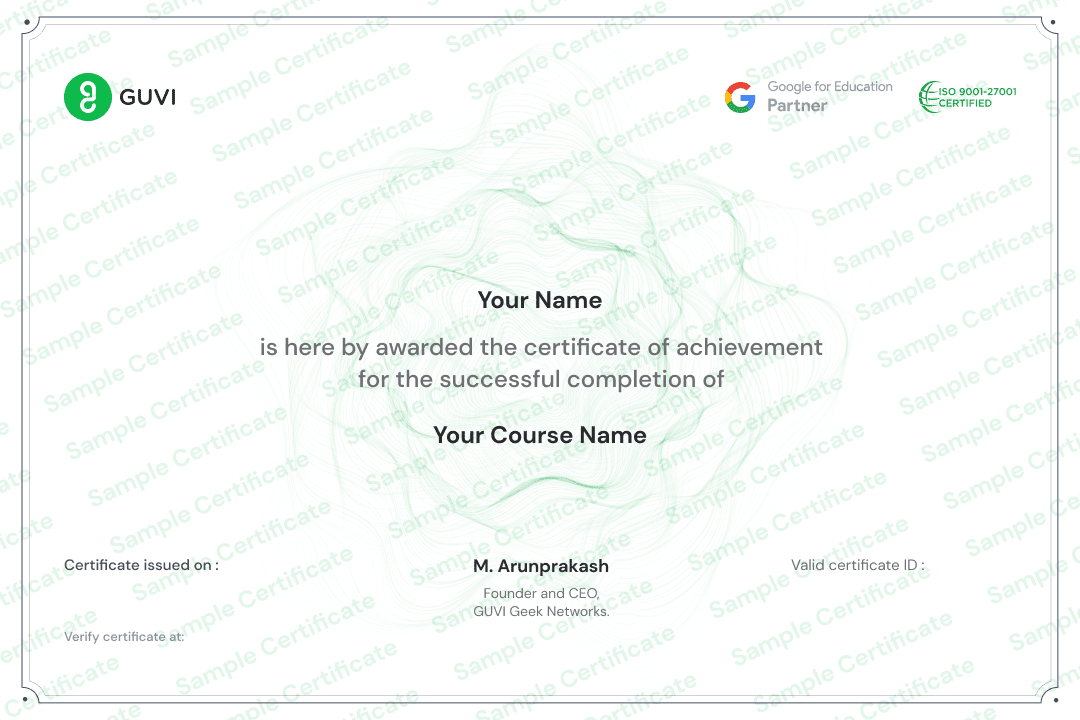
Certificate you will get

Certificate Features

Certification from IITM Pravartak.
Certifications strengthen your programming profile and are recognized around the world.
Certificates are awarded upon the course's completion.

Pre Requsites

A basic familiarity with the Python programming language.
An interest in learning how to visualize data using Matplotlib in Python.

After this Course

Efficiently use Matplotlib for data visualization.
Use PyPlot for specifying, formatting, and customizing data.
Embed various types of plots into applications using general-purpose toolkits.
Work with Jupyter Notebook, Matplotlib, and its dependencies.
Visualize vast amounts of data as various types of 2D and 3D plots.
Be able to incorporate Audio data as well as images and work with them.

Course is for

Freshers

Professionals

Students

FAQ's

  • What is matplotlib in python?
    Matplotlib is a comprehensive, open-source plotting toolkit in the Python programming language that serves as a data visualization utility and is widely used for representing data as static, interactive, and animated visualizations.
  • How to learn matplotlib in python?
    Matplotlib is a very popular Python library used to perform data visualizations on vast amounts of data. The best way to learn how to work with Matplotlib is with an online certification course as they are precise, up-to-date with the latest advancements, self-paced, and taught by industry experts with a focus on getting you job ready.
  • Why learn matplotlib in python from GUVI?
    Utilizing Matplotlib for performing data visualization requires you to master all the concepts from the very basics to an advanced level. And this Data Visualization with Matplotlib in Python course by GUVI will give you a firm understanding of all of these concepts as well as the latest advancements in the field, it is designed and taught by industry experts with years of experience, is self-paced and provides you with a globally recognized certificate upon completion.
  • What are the benefits of learning Data visualization using matplotlib online?
    Learning Data Visualization using Matplotlib online can be quite beneficial as the courses are self-paced and you can learn anywhere, at any time, the curriculum is precise and regularly updated, they are designed by experts who have vast experience in their fields, and you gain a swanky certificate that helps you stand out when applying to jobs.
  • How to install matplotlib in python?
    To install Matplotlib, you will first need to install Python which can be done by searching on google and installing the latest version from the official distribution source. After installing Python, install PIP by using the command: ‘Run python get-pip.py’ and then install Matplotlib by using the following command:’ C:UsersYour Name>pip install matplotlib’.
The course focuses on Data Visualization with Matplotlib in Python. It covers fundamentals through 3 interactive modules designed for Beginners.
The course offers over 7 hours of recorded content.

Yes, upon completing the course, you will receive a certification

The course is currently available in English.
A basic familiarity with the Python programming language. & An interest in learning how to visualize data using Matplotlib in Python.

The course is accessible on both web and mobile platforms.

The original price of the course is ₹2000, but it’s currently available at a discounted price of ₹1799.
To purchase this course you can click on the Enroll Now button it will redirect you to course page, and on that page you can buy Data Visualization with Matplotlib in Python course.

Similar Courses

Share this course within your network

WhatsApp
Facebook
Telegram
LinkedIn
Threads
X

Page Link