Search
Close this search box.

Data Visualization in Python

by

Guvi

This course on Data Visualization in Python teaches Data Visualization in Python fundamentals through 3 interactive modules. If you are Beginner, then this course is for you. You can access this course on web and mobile, it’s available in English language.
1699.00
2000.00
15.05% Discount

#1

See all ranking

Data Visualization in Python

by

Guvi

This course on Data Visualization in Python teaches Data Visualization in Python fundamentals through 3 interactive modules. If you are Beginner, then this course is for you. You can access this course on web and mobile. This complete course is available in English language.
1699.00
2000.00
15.05% Discount

#1

See all ranking

3 Modules

with Certifications

17+ Hours

of Recorded Content

4.58 Rated

by 20578 Learners

Language

3 Modules

with Certifications

17 + Hours

of Recorded Content

4.58 Rated

by 20578Learners

Read all Reviews

Language

What's in it for You?

One of the most important skills of revered data scientists and analysts is how they can visualize data, draw meaningful insights from it and present it in an approachable and stimulating manner that aids decision-making for all kinds of businesses. With this beginner-friendly Data visualization in Python course, you will explore some of Python’s most popular and robust data visualization libraries such as Matplotlib, Seaborn, Bokeh, and learn how to implement them on vast amounts of data. You will gain the skills needed to plot and present data in a way that makes sense to people from all backgrounds and also learn to leverage tools such as Anaconda and Jupyter Notebook. After completing this course, you will be able to perform data visualization on real-world datasets.

Key Features:

Internationally Acknowledged Certification
Completely online and learn at your own pace course
Lifelong access to complete course
Four gamified practice platforms
Committed forum support to answer all of your questions
Refund policy of seven days

Topics you will learn

  • Beginner Module

    • Introduction to Data Visualization
    • Matplotlib for Data Visualization
    • Using Matplotlib to draw plots
    • Visualizing & Customizing Plot appearances using Matplotlib
    • Multiple Line PLots
    • Basics of Time Series Plotting
    • Time Series Plotting and adding styles to the plots
    • Slicing and Customizing Time Series Data
    • Twin Axes Plotting
    • Bar Plot and Box Plots
    • Violin, Histogram and Scatter
    • Contour Plot and Annotations in Matplotlib
    • Advance Annotations
    • Image Tutorial in matplotlib
  • Intermediate Module

    • Introduction to Seaborn Library
    • Relational Plots and Subplots in Seaborn
    • Subplotting in Rows and Columns using Relational Plot
    • Line Plots in Seaborn
    • Bar Plots, Box Plots and Point Plots in Seaborn
    • Colour Palettes in Seaborn
  • Advanced Module

    • Introduction to BOKEH
    • Patch Plots and Scatter Marks in Bokeh
    • Area Plots and Circle Glyphs in Bokeh
    • Rectangle, Oval and Polygon Glyphs in Bokeh
    • Wedges, Arcs and Specialized curves in Bokeh
    • Setting Plot ranges and Axes in Bokeh Plots
    • Twin Axes, Datetime axes and Annotations in Bokeh Plots
    • Categorical and Log Axes in Bokeh
    • Row and Column Layouts in Bokeh Plots
    • Customizing Tools and Legends in Bokeh Plots
    • Column Data Source and Adding Widgets to Bokeh Plots

Course Offerings

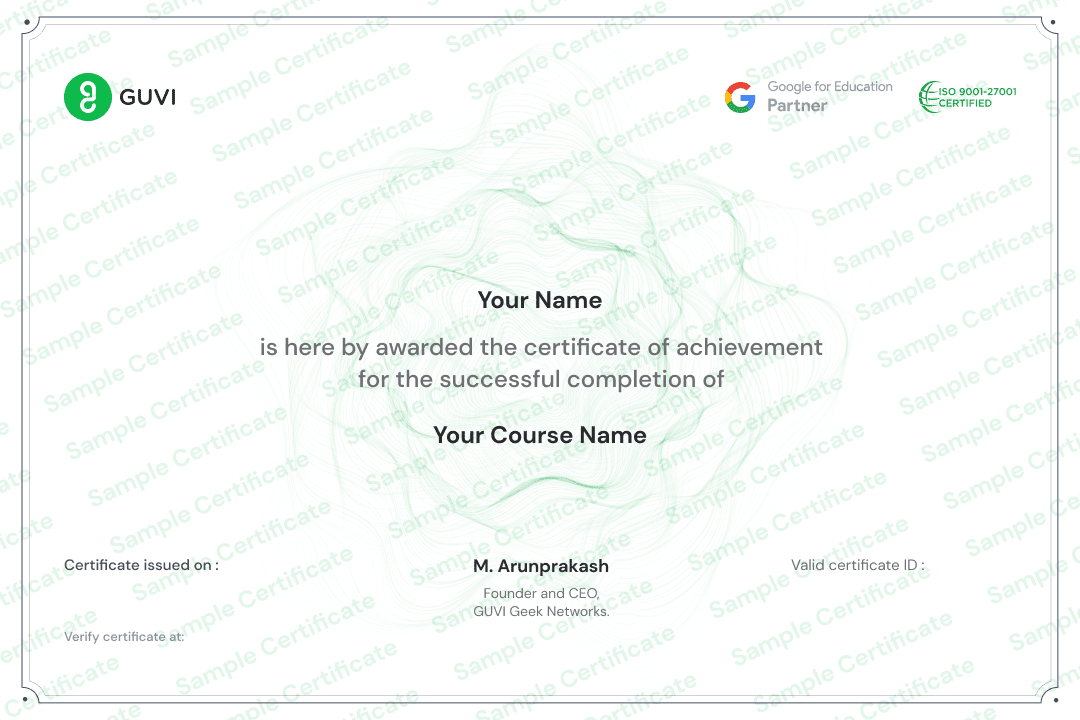
Certificate you will get

Certificate Features

Certification from IITM Pravartak.
Certifications strengthen your programming profile and are recognized around the world.
Certificates are awarded upon the course's completion.

Pre Requsites

An interest in performing data visualization to draw meaningful insights from large amounts of data.
Basic knowledge of the Python programming language.

After this Course

Have a strong grasp of Data Visualization concepts with Python.
Be proficient in working with Matplotlib, and using it to visualize data.
Learn how to use Seaborn and visualize data with various types of plots.
Work with Bokeh and be able to spin up advanced annotations.
Perform data visualization on vast amounts of data and real-world datasets.
Efficiently make use of tools such as Python, Anaconda, and Jupyter Notebook for data visualization.

Course is for

Freshers

Professionals

Students

FAQ's

  • What is data visualization in python?
    Data visualization can be termed as the act of presenting data in a stimulating and approachable manner after extracting it from vast amounts of data using various tools and techniques so that it can be leveraged for decision-making and tracking various trends. Python provides various robust libraries such as Matplotlib, Seaborn, Bokeh, and more that greatly assist in performing data visualization in a simplified manner.
  • How to learn data visualization in python?
    You can effectively perform data visualization in Python with the help of either online resources by yourself or opt for online certification courses that are not only beginner-friendly but also precise and up-to-date. Learning by yourself without a distinct curriculum can take too long, whereas online courses such as this one by GUVI help you master the most in-demand skills with industry experts and become job ready.
  • Why learn data visualization in python from GUVI?
    The Data Visualization in Python course offered by GUVI is one of the best online certification courses as it has been both curated and taught by industry experts with years of on-field experience. It teaches all the in-demand data visualization skills, provides you with award-winning practice platforms, is self-paced, and regularly updated and you can earn a globally-recognized certificate upon completion.
  • What are the benefits of learning Data visualization online?
    If you choose to learn data visualization through an online course, you can learn at your own pace, from anywhere, and at any time. Besides this, online courses are always up-to-date with the most in-demand skills, are designed and taught by people working in the industry, are precise with a focus on making you job ready, and provide you with a swanky certificate to prove your newly gained skills.
  • How to do data visualization in python?
    Python provides us with various popular and robust libraries such as Matplotlib, Seaborn, Bokeh among others using which we can effectively perform data visualization on vast amounts of data for efficient decision-making.
The course focuses on Data Visualization in Python. It covers fundamentals through 3 interactive modules designed for Beginners.
The course offers over 17 hours of recorded content.

Yes, upon completing the course, you will receive a certification

The course is currently available in English.
An interest in performing data visualization to draw meaningful insights from large amounts of data. & Basic knowledge of the Python programming language.

The course is accessible on both web and mobile platforms.

The original price of the course is ₹2000, but it’s currently available at a discounted price of ₹1699.
To purchase this course you can click on the Enroll Now button it will redirect you to course page, and on that page you can buy Data Visualization in Python course.

Similar Courses

Share this course within your network

WhatsApp
Facebook
Telegram
LinkedIn
Threads
X

Page Link